Are We There Yet? Using Circles To Measure Progress
There's an old saying (with variations) that says:
"the first 50 percent of a project takes 90 percent of the time and effort;
The remaining 50 percent of the project takes the other 90 percent of the time and effort."
A similarly pessimistic sentiment about project estimation says:
"It always takes longer than you expect - even when you take into account the fact that it will take longer than you expect"
(source anyone? Mythical Man Month?)
You can't use a straight line to plot progress. Instead we make a lot of progress at first. And by the end progress slows to a crawl. But it isn't asymptotic to completion -- completion is eventually achieved.
I tried the simplest equation I know of that has this property -- a circle. (Well a quarter of a circle, to be precise)...
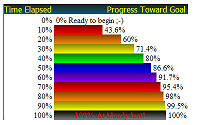
How far through do you feel you are? How far through are you really?
ActualProgress = Sqrt( 100^2 - (100 - ApparentProgress)^2 )
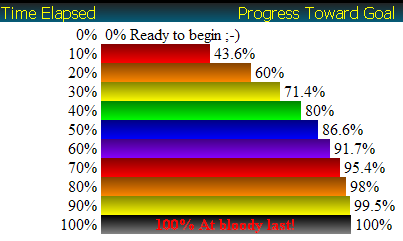
How To Read The Above Chart
When I think I'm half way there -- I'm not even 20% of the way there.
When I think I'm 99.5% of the way there -- sorry but that last half of a percent takes ten percent of the total time.
When I feel like I'm 87% of the way there --- I'm really only half way there.
When I feel like I'm 90% of the way there --- I'm not even 60% of the way there.
Anyway -- this was all just an exercise in dodgy-hand-waving-mathematics, but I like it. Don't use this formula for drawing up a billion-dollar-space-shuttle-budget, or anything like that.
Next → ← PreviousMy book "Choose Your First Product" is available now.
It gives you 4 easy steps to find and validate a humble product idea.